Aracı Kurum Hesap Bağlantısı

Aracı Kurum Sembol Tip Miktar Fiyat Tutar Satılabilir Maliyet K/Z

Sembol Tip Miktar Fiyat Tutar Satılabilir Maliyet K/Z
marbas-logo
Marbaş Menkul Değerler hesabınıza erişim için lütfen bilgilerinizi giriniz.

Sembol Tip Miktar Fiyat Tutar Satılabilir Maliyet K/Z
colendi-logo
Colendi Menkul Değerler hesabınıza erişim için lütfen bilgilerinizi giriniz.
Logo

KERVN

KERVANSARAY YATIRIM HOLDİNG A.Ş.
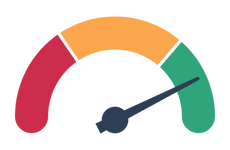
Boğa
Trend
Boğa
Düşük
Volatilite
Düşük
Düşük
Hacim
Düşük
Satım
Momentum
Satım
Dipte
Pozisyon
Dipte
Yukarı
Gap
Yukarı
Seans Bilgileri
17.09.2025 07:00:01
Bu alana sadece Plus ve Pro üyelerimiz erişim sağlayabilmektedir.
Üyeliğini yükselt
Yapay Zeka Firma İçin Ne Diyor?
Valuation
  • P/B ratio is at 1.60. This is higher than the sector median of 1.26 and lower than the market median of 1.69. P/B indicates market value relative to book; below 1.0 often signals discount to asset base.
  • EV/EBITDA is at -97.80. This is lower than both the sector median (0.34) and the market median (11.40). EV/EBITDA links enterprise value to cash generation; elevated levels are sensitive to forward expectations.
Profitability
  • Net Profit Margin is at -185311.03%. This is below both the sector median (-0.05%) and the market median (0.33%). Margins directly inform on cost structure and pricing power.
  • Gross Margin is at 6.27%. This is below both the sector median (24.33%) and the market median (20.22%). Margins directly inform on cost structure and pricing power.
  • Operating Margin is at -34776.44%. This is below both the sector median (7.11%) and the market median (6.09%). Margins directly inform on cost structure and pricing power.
  • ROA is at -2.21%. This is below both the sector median (2.36%) and the market median (2.27%). ROA gauges efficiency of asset utilization; capital intensity matters.
  • ROE is at -138.10%. This is below both the sector median (0.70%) and the market median (0.31%). ROE captures return on equity; leverage and profitability dynamics drive outcomes.
Capital Structure & Liquidity
  • Debt/Equity is at 0.91. This is higher than both the sector median (0.33) and the market median (0.39). Debt/Equity denotes leverage; cash-flow resilience is key.
  • Leverage Ratio is at 91.48. This is higher than both the sector median (32.77) and the market median (38.87). Leverage ratio reflects debt-funded assets; higher levels may amplify volatility.
  • Current Ratio is at 0.02. This is below both the sector median (1.57) and the market median (1.47). Current ratio shows coverage of short-term obligations by current assets.
  • Quick Ratio is at 0.02. This is below both the sector median (1.00) and the market median (0.99). Quick ratio assesses near-cash coverage excluding inventories.
Performans

1G

0,00%

1H

2,14%

1A

-10,90%

1Y

43,72%
Rasyolar
Hisse Başına Kar
-1.03
Hisse Başına Defter Değeri
5
Toplam Borç/Toplam Varlık
0.91
Faal. Geliri/Faiz Gideri
-
F/K
-
PD/DD
1.6
FD/FAVÖK
-97.8
FAVÖK
-12.654.078
Cari Oran
0.02
Likit Oran
0.02
Nakit Oran
-
Kaldıraç Oranı
91.48
Borçlar/Özsermaye
0.91
M.Duran Varlık/Özsermaye
8.18
K.Vadeli Borçlar/Toplam Borçlar
-
Alacak Devir Hızı
0
Alacak Tahsil Süresi
1065624.32
Stok Devir Hızı
207.07
Stokta Kalma Süresi
1.76
Net İşl. Ser. Devir Hızı
0
Özkaynak Devir Hızı
0
Aktif Devir Hızı
0
Ticari Borç Devir Hızı
0
Ticari Borç Ödeme Süresi
1235888.03
Brüt Kar Marjı
6.27
Net Kar Marjı
-185311.03
Faaliyet Kar Marjı
-34776.44
Aktif Karlılık Marjı
-2.21
Özsermaye Karlılık Marjı
-138.1
Esas Faaliyet Kar/Zararı
-199.901.605
Fin. Gid. Öncesi Faal. K/Z
-200.368.841
Net Dönem Kar/Zararı
-1.065.202.981
Net İşletme Sermayesi
-6.650.670.265
Hisse Sinyalleri
Bu alana sadece Plus ve Pro üyelerimiz erişim sağlayabilmektedir.
Üyeliğini yükselt
Notlarım